
Make a donation
Gear up for your next adventure:
As an Amazon Associate, this site earns from qualifying purchases at no extra cost to you.
London topographic map
Click on the map to display elevation.
Make a donation
Gear up for your next adventure:
As an Amazon Associate, this site earns from qualifying purchases at no extra cost to you.
London
London has a humid continental climate (Köppen Dfb), though due to its downwind location relative to Lake Huron and elevation changes across the city, it is virtually on the Dfa/Dfb (hot summer) boundary favouring the former climate zone to the southwest of the confluence of the South and North Thames Rivers, and the latter zone to the northeast (including the airport). Because of its location in the continent, London experiences large seasonal contrast, tempered to a point by the surrounding Great Lakes. The summers are usually warm to hot and humid, with a July average of 20.8 °C (69.4 °F), and temperatures above 30 °C (86 °F) occur on average 11 days per year. In 2016, however, temperatures at or above 30 °C (86 °F) occurred more than 35 times, and in 2018, four heatwave incidents led to humidex temperatures topping out at 46 °C (115 °F) . The city is affected by frequent thunderstorms due to hot, humid summer weather, as well as the convergence of breezes originating from Lake Huron and Lake Erie. The same convergence zone is responsible for spawning funnel clouds and the occasional tornado. Spring and autumn in between are not long, and winters are cold but witness frequent thaws. Annual precipitation averages 1,011.5 mm (39.82 in). Its winter snowfall totals are heavy, averaging about 194 cm (76 in) per year, although the localized nature of snow squalls means the total can vary widely from year to year as do accumulations over different areas of the city. Some of the snow accumulation comes from lake effect snow and snow squalls originating from Lake Huron, some 60 km (37 mi) to the northwest, which occurs when strong, cold winds blow from that direction. From 5 December 2010, to 9 December 2010, London experienced record snowfall when up to 2 m (79 in) of snow fell in parts of the city. Schools and businesses were closed for three days and bus service was cancelled after the second day of snow.
Make a donation
Gear up for your next adventure:
As an Amazon Associate, this site earns from qualifying purchases at no extra cost to you.
About this map
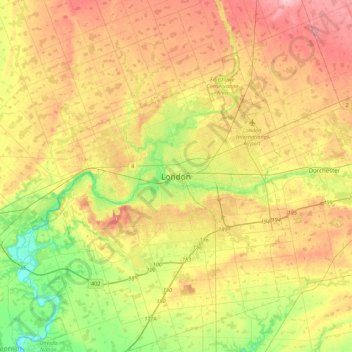
Name: London topographic map, elevation, terrain.
Location: London, Ontario, N6A 3N7, Canada (42.82324 -81.40337 43.14324 -81.08337)
Average elevation: 269 m
Minimum elevation: 203 m
Maximum elevation: 340 m
Make a donation
Gear up for your next adventure:
As an Amazon Associate, this site earns from qualifying purchases at no extra cost to you.
Other topographic maps
Click on a map to view its topography, its elevation and its terrain.
Newmarket
Canada > Ontario > York Region
Newmarket's geographical coordinates are 44.05°N, 79.46°W, and its elevation above sea level is 252 m. It has an area of 38.33 km2. The town is bounded on the south by Aurora, on the west by King, on the north by East Gwillimbury and on the east by Whitchurch–Stouffville.
Average elevation: 270 m
Yellowhead Island
Canada > Ontario > Muskoka District > Georgian Bay Township
Average elevation: 182 m
Make a donation
Gear up for your next adventure:
As an Amazon Associate, this site earns from qualifying purchases at no extra cost to you.
Make a donation
Gear up for your next adventure:
As an Amazon Associate, this site earns from qualifying purchases at no extra cost to you.
Papineau Lake;Wapoose Creek
Canada > Ontario > Thunder Bay District > Greenstone
Average elevation: 347 m
Make a donation
Gear up for your next adventure:
As an Amazon Associate, this site earns from qualifying purchases at no extra cost to you.
Nungesser Lake
Canada > Ontario > Kenora District > Unorganized Kenora District
Average elevation: 412 m
Make a donation
Gear up for your next adventure:
As an Amazon Associate, this site earns from qualifying purchases at no extra cost to you.
Make a donation
Gear up for your next adventure:
As an Amazon Associate, this site earns from qualifying purchases at no extra cost to you.
Tipperary Island
Canada > Ontario > Leeds and Grenville Counties > Leeds and the Thousand Islands
Average elevation: 103 m
Make a donation
Gear up for your next adventure:
As an Amazon Associate, this site earns from qualifying purchases at no extra cost to you.
Make a donation
Gear up for your next adventure:
As an Amazon Associate, this site earns from qualifying purchases at no extra cost to you.
Make a donation
Gear up for your next adventure:
As an Amazon Associate, this site earns from qualifying purchases at no extra cost to you.
Kawartha Highlands Signature Site
Canada > Ontario > Peterborough County > North Kawartha
Average elevation: 306 m
Barrie
On September 7, 1977, a private aircraft, flown by "Army" Hollingsworth, dropped altitude to 500 feet (152 m) in dense fog and struck CKVR's 1,000-foot (305 m) transmitter tower, killing all five people aboard the plane and destroying the tower and antenna. The station's 225-foot (69 m) auxiliary tower was…
Average elevation: 265 m
Make a donation
Gear up for your next adventure:
As an Amazon Associate, this site earns from qualifying purchases at no extra cost to you.